MAD data analysis cites audience build-up in Mumbai, Delhi, Goa markets
By Rajiv Raghunath - August 04, 2020
Moving Walls, powered by its patented audience movement analysis approach - Moving Audiences Decisions (MAD) data analysis, based on multiple data-sets captured from 102 locations around grocery outlets in the three cities, underscores the nature of audience movement in the face of the Covid-19 situation. Moving Walls has exclusively collaborated with Media4Growth to provide an up-close view of OOH audience metrics in Indian cities
A Moving Audiences Decisions (MAD) data analysis of audience movement near grocery outlets in the cities of Delhi, Mumbai and Goa reveals a definitive presence of different audience segments on the streets who would be potentially consuming the advertising on OOH media formats that are located in the close proximity of select grocery outlets. Moving Audiences Decisions is the data solutions arm of Singapore headquartered adtech major Moving Walls.
The findings, based on data captured from 102 locations in each city in the period June 8 -21, 2020, show that ‘food lovers’ turn out on the streets of Goa are significantly high as compared to those in Mumbai and Delhi. Figure 1 attests to this.
Fig 1: Audience segmentation of grocery outlet visitors
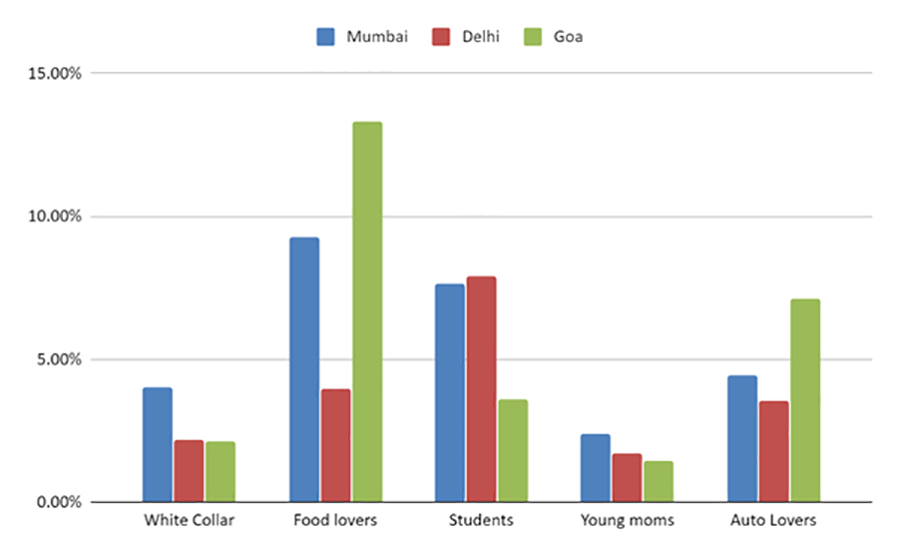
As can be ascertained from Figure 1, ‘white collar’ worker turn out on the streets was higher in Mumbai as compared to Delhi and Goa, whereas student presence on the streets was considerably higher in Mumbai and Delhi as compared to Goa.
The presence of ‘young moms’ near the grocery stores was marginally higher in Mumbai as compared to Delhi and Goa, whereas ‘auto lovers’ were present in greater numbers on the streets of Goa as compared to Mumbai and Delhi.
The audience segmentation would serve as compelling direction finders for particular OOH advertising brands that are planning for campaigns in the two biggest markets – Mumbai and Delhi, and Tier I cities like Goa.
Grocery outlets were taken as the locations for the study as those places witnessed dynamic audience movement in the pandemic situation, regardless of the locations being in the ‘red’, ‘orange’ or ‘green’ Covid zones.
A further analysis of the potential reach of OOH advertising in the three cities reveals:
In Mumbai:
- Of a potential 52.7 million views (total audience in the vicinity of the billboard including repeats; synonymous to impressions), 8.3 million views would have been achieved.
- An average person had the opportunity to see the campaign 6 times across the locations (frequency).
- Overall, the campaign would have reached 0.63% of India’s population.
In Delhi
- Of the 38.5 million potential views, 5.3 million views would have been achieved.
- An average person had the opportunity to see the campaign 7 times across the locations (frequency).
- The campaign would have reached 0.40% of India’s population.
In Goa
- Of the 11.3 million potential views, 1.2 million reach would have been achieved.
- An average person had the opportunity to see the campaign 9 times across the locations (frequency).
- Moreover, the campaign would have reached 0.09% of India’s population
Pertinent to note that the population size (basis 2011 census) of the three cities are:
- Mumbai: 18,400,000
- Delhi: 11,034,555
- Goa: 1,459,000
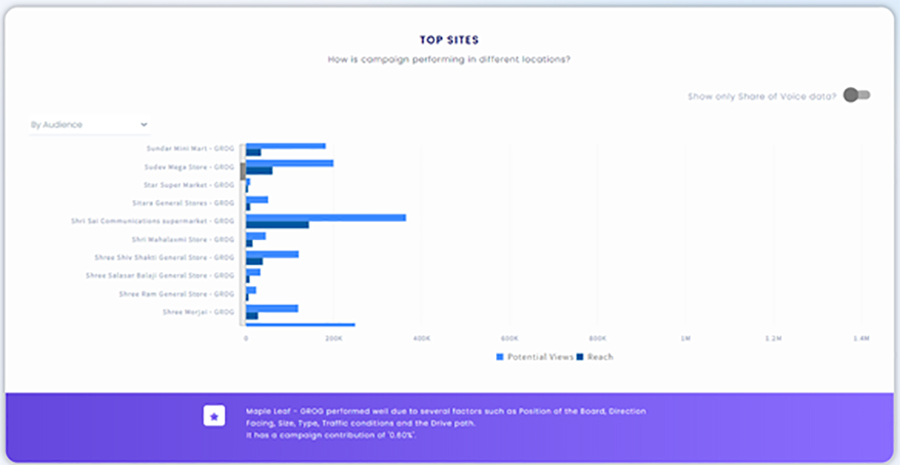
An analysis of the site performance is illustrated in Fig 2, 3 & 4:
Fig 2: Grocery outlets – Mumbai
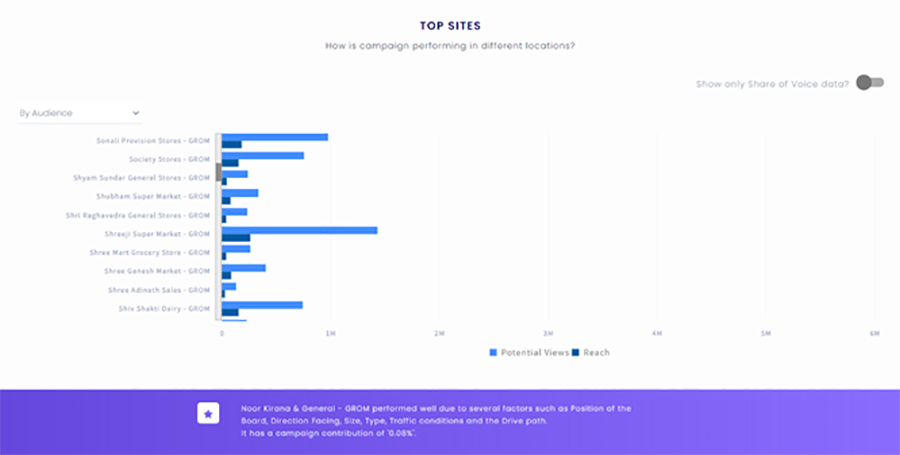
Fig 3: Grocery outlets – Delhi
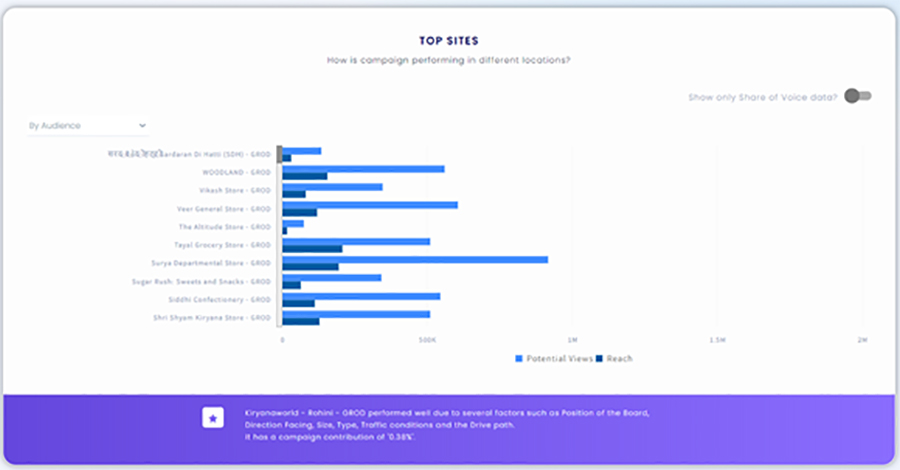
Fig 4: Grocery outlets – Goa
The Frequency counts per location reveal how many times an individual has been exposed to the ads taking into account travelling to-and-fro from the grocer y stores.
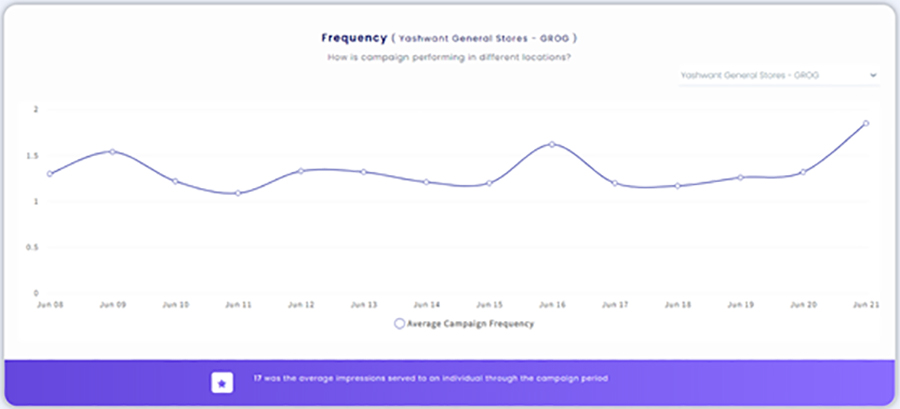
Goa witnesses the highest frequency in audience movement which is evident since it was in the Green zone with comparatively relaxed norms prevailing compared to Delhi and Mumbai. These are depicted in Figures 5, 6, 7.
Fig 5: Mumbai - Frequency Overview
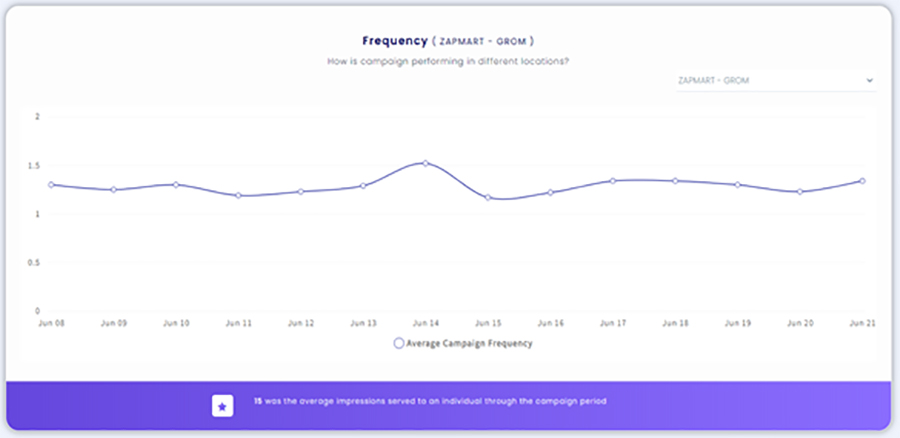
Fig 6: Delhi - Frequency Overview
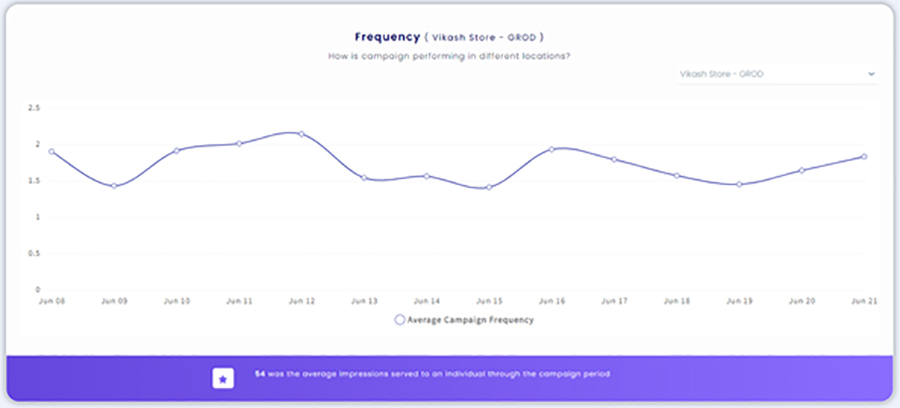
Fig 7: Goa - Frequency Overview
The MAD data was sourced from social media (Instagram and Twitter data); traffic (Google Traffic Data); video (camera); GPS (Device movement data from MAD data aggregators); and LAMP (Location Audience Measurement Platform which is an iOT device capturing Wifi and Bluetooth transmitters).
MAD’s Location Intelligence powers planning and reporting for marketers and advertisers across South and South East Asia.
Stay on top of OOH media trends